
Allowing for scale
When developing an application or system, scale is an importamt factor. This post looks at some of the things I learned while developing eVitabu.


When developing an application or system, scale is an importamt factor. When building a network I tend to think about scale, but when developing software it's not something I naturally consider. Until eVitabu, all of my systems had been low usage and this showed in some of my early design decisions.
I'm used to writing systems where the whole database is perhaps 10MB in size at most. The largest database entity in the Skullduggery LARP Games Control (GC) web application is perhaps a few thousand rows, searchable in less than a second. GC runs on fairly run-of-the-mill hardware: a home user laptop running a Linux virtual machine on top of Windows - not server grade by any means. We can perform almost all actions without any particular lag in the interface (caused by either hardware or software) so there are no performance concerns. eVitabu changed how I had to think about things, and that's thanks (again) to Adam, who pointed out an issue before it became a massive problem. Unfortunately Mike and I had run into the first problem before then - search.
Searching
Our biggest scale issue (and thus performance gain) was when searching. Initially the app would search on a single letter, more an oversight than a design decision. The eVitabu app used to work like this when searching:
- Connect to EVM (eVitabu's management back-end) via Internet connection
- Authenticate
- Download XML list of contributors and content
- Type first character, repeat the above steps, search the XML, return the results
- Type second character, repeat the above steps, return the results
- ...
Searching like this was fine (albeit inefficient) in the development system with a handful of records. As you'd expect, the results were returned very quickly. As the system grew to a few hundred records things got a bit slower, but still manageable. One morning I bulk loaded around 3,000 items of content and the app became unusable: searches would hang the app temporarily or it would crash altogether.
My first focus, given my main area was the web back-end, was to see how long the XML was taking to generate. There were some areas for improvement when it came to the query being executed and how that object was returned. With Adam's help we managed to shave a second or two there. Caching was also added to the web application so the XML is generated once every ten minutes, reducing any lag caused by the database.
Once the web application had been optimised appropriately, the Android app then needed some work. Mike quickly added his own caching, so the XML isn't downloaded for each change of activity (screen) in the app. The search was also configured to only trigger after 3 characters had been entered. Search issues were resolved at this point, the app becoming more stable as a result.
A nice side effect of these improvements was that bandwidth usage was also reduced, given the XML was downloaded less often. eVitabu's target users rely on mobile 3g/4g Internet most of the time and that's charged in bytes (in Uganda at any rate). Clearly the reduction in data we were sending would have a positive affect on their quotas and bank balance.
Excessive logging
I'd noticed in my logs that for every change of activity in eVitabu I would receive several log entries for authentication and XML log downloads. For less than 5 minutes in the app I had over 30 entries in the logs and while I wasn't considering scale, that did upset my sense of correctness. Logs were going to use a lot of disk space if we kept that up! After a few changes XML downloads only log on demand, to help troubleshoot end user problems. The same is true for authentication, as in order to download a resource (which is still logged) you have to be logged in so we can see that you did authenticate. Exactly when you authenticated is not of particular interest.
Calculating download counts
Given downloads of a resource are logged it isn't difficult to determine how popular each resource was. My initial plan was to search the log for the download event and resource ID, counting the entries. In a similar vein to searching, this was fine in the development environment but as soon as the production environment hit several thousand items of content things got slow. The download count is shown on each content row, like this:
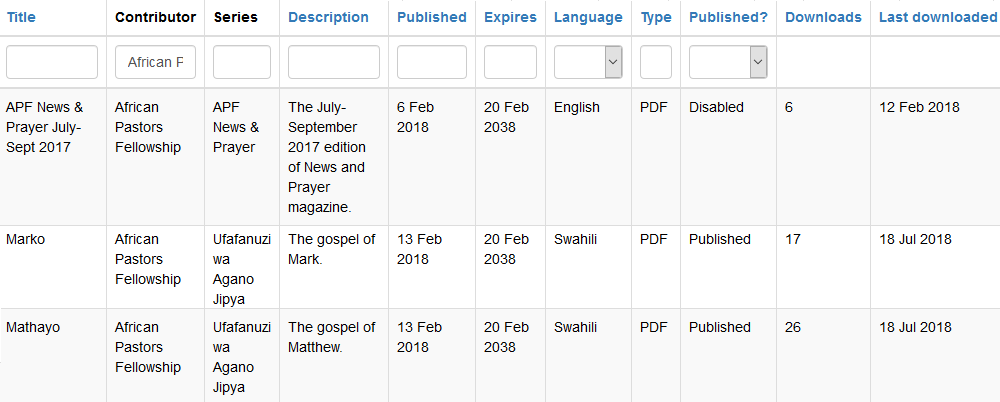
This meant for every row there was a query being run to go through the log, find download events for that content and count them. As the number of published resources increased so did the number of queries. Add to that the expanding number of downloads and log entries in general and things started to get quite slow, initially shown by the amount of time taken to render the list of content. Fortunately the content list is capped at 20 entries per page, otherwise with 3,100 resources and 61,000 log entries (as of September 2018) we'd be looking at timeouts.
Fortunately, the solution to this performance issue is quite simple. When downloading a resource, update two new columns on the resource table row itself - count (increase by one) and last downloaded date. There are also plans to change it so only unique (per user) downloads are logged as ultimately APF need to see which resources are used by most people, without the statistic being skewed by repeated downloads.
Development / testing vs production environments
A lot of these problems would have been noticed earlier on if my development (and testing) environment had been more like the production one. The test environment, where we point the app to check everything works, generally runs with around 5 contributors and 10 pieces of content. Contrasting that to production with over 3,000 published resources and that's quite a difference. I've certainly learnt to create more dummy data in the test environment in future.
What about cost implications?
Leaving the web application in an inefficient state would eventually have impacted on the overall project running costs. Too much logging would use up disk space quickly. Inefficient queries would use more RAM than necessary, one of the first things I noticed. The original query to generate a list of available resources was using over 100MB RAM (sometimes more, hitting PHP memory limits) to generate a file less than 8KB and today the XML for that API call is 1MB in size - that wouldn't have scaled up well. If APF had to buy a better VM from DigitalOcean as a result of poor programming it would have had a negative impact on their project and would, frankly, have been embarassing!
Are there more improvements?
Clearly, there always are. We're already looking at reducing bandwidth usage further using compression (the Android app doesn't support it yet). I'm also considering re-enabling a CDN such as Cloudflare now I've a (simple) way around the upload limits we were hitting before.
Banner image, "performance graph", from OpenClipart.org, by GusEinstein.